Triaging an Apache 503 from the edge inward, and the monitoring that would have caught it
A staging environment I look after started returning HTTP 503. Nothing had been deployed and Apache was running. The two application services behind it weren’t.
Fixing it took minutes. Noticing it took about 39 hours, because nothing was alerting on that environment. This post covers two things: the outside-in method I use to find a 5xx quickly, and a small lab I built afterwards to show the monitoring that would have caught it.
The lab is a recreation with generic names. No hostnames, configuration or code come from the real system. The lab code is on GitHub: edge-inward-lab.
What happened
The environment was a single VM: Apache as a reverse proxy, with two app services behind it, each a systemd unit on ports 8100 and 8101. Both had been stopped in an interactive root session.
Both units had Restart=always, and that’s the detail that catches people out. systemd’s restart policy reacts to a service exiting, such as a crash, a non-zero exit or a watchdog timeout. A deliberate systemctl stop isn’t a failure, so systemd leaves the unit stopped. The host was healthy, Apache was healthy, and the restart policy was configured “correctly”. Users still got a 503, and nobody was told.
Triage: start where the user is and work inward
With a 5xx at the edge, the fastest route to the cause is to test one layer at a time from the outside in. Each step either clears a layer or points at it.
- Edge. What does a user actually get?
curl -ithe public URL. A503from Apache means it’s up but can’t serve the request. - Web server. Is Apache itself healthy? Check its status page or
systemctl status apache2. If Apache is fine, the problem is behind it. - Backend ports. Is anything listening where Apache proxies to? Use
ss -ltnp, or a directcurlto127.0.0.1:8100. - Processes. Are the services running at all? Check
systemctl statusand the unit’s journal. - Logs. Apache’s error log says exactly what it tried.
AH00957 ... Connection refusedmeans it reached the host and nothing answered on the port.
In the real incident, step 3 gave the answer (nothing was listening) and step 4 explained it (both units were inactive, stopped by hand). I restored them over SSM Session Manager and the site came back.
The fix was simple. The real problem was the 39 hours, and that’s what the rest of this post is about.
Rebuilding it as a lab
I wanted something reproducible that I could break on purpose, so I rebuilt the shape of the environment with Docker Compose:
- an Apache container proxying
/api/to port 8100 and/to port 8101 - an app container running both services. Its PID 1 stays alive when the services stop, so it behaves like a VM whose units were stopped
- Prometheus, the blackbox exporter, Alertmanager and Grafana for monitoring
- three scripts:
break.shstops the services the way a manual stop would,fix.shstarts them again, andtriage.shruns the five steps above
Docker turned out to reproduce the restart trap faithfully. The app container has restart: always, but the container never exits (only the processes inside it stop), so Docker never restarts anything. It’s the same thing that happened with systemd in a different runtime.
The monitoring design: probe each layer separately
The key decision was what to monitor. App metrics wouldn’t have helped: a service that isn’t running can’t export metrics. The failure was “nothing is listening”, and you can only see that from outside.
So everything is a blackbox probe, and each probe is tagged with the layer it tests:
| Layer | Probe | Answers |
|---|---|---|
edge |
http://apache/, http://apache/api/health |
Are users affected? |
webserver |
Apache’s /server-status |
Is Apache itself up? |
backend |
http://app:8100/health, :8101/health, bypassing Apache |
Are the services listening? |
Here’s the Prometheus side, trimmed. Every probe job uses the same relabelling, so only the targets and the layer label change:
- job_name: probe-backend
  metrics_path: /probe
  params: { module: [http_2xx] }
  static_configs:
    - targets: [http://app:8100/health, http://app:8101/health]
      labels: { layer: backend }
  relabel_configs:
    - source_labels: [__address__]
      target_label: __param_target
    - source_labels: [__param_target]
      target_label: instance
    - target_label: __address__
      replacement: blackbox:9115
The alert rules mirror the layers. One alert covers the symptom (users are affected) and one covers the cause (which part is down):
- alert: EdgeUnavailable          # symptom: users get errors
  expr: probe_success{layer="edge"} == 0
  for: 1m
  labels: { severity: critical }

- alert: BackendServiceDown       # cause: where to look first
  expr: probe_success{layer="backend"} == 0
  for: 1m
  labels: { severity: warning }
A few choices worth explaining:
for: 1m. One failed scrape isn’t an outage, but four in a row at a 15-second interval is. For staging, a minute of delay is a fair trade for not paging on blips.- Severity split. In a real setup only
criticalwould page. The backend alert is there to tell whoever responds where to look, not to wake a second person. - Inhibition. If Apache itself is down, every edge probe fails too. An Alertmanager inhibit rule suppresses
EdgeUnavailablewhileWebServerDownis firing, so you get one alert about the cause instead of a pile of symptoms. - Monitoring the monitoring. If the blackbox exporter dies, every probe goes quiet, and that mustn’t look like “all good”. A separate
ProberDownalert covers it.
Running the incident
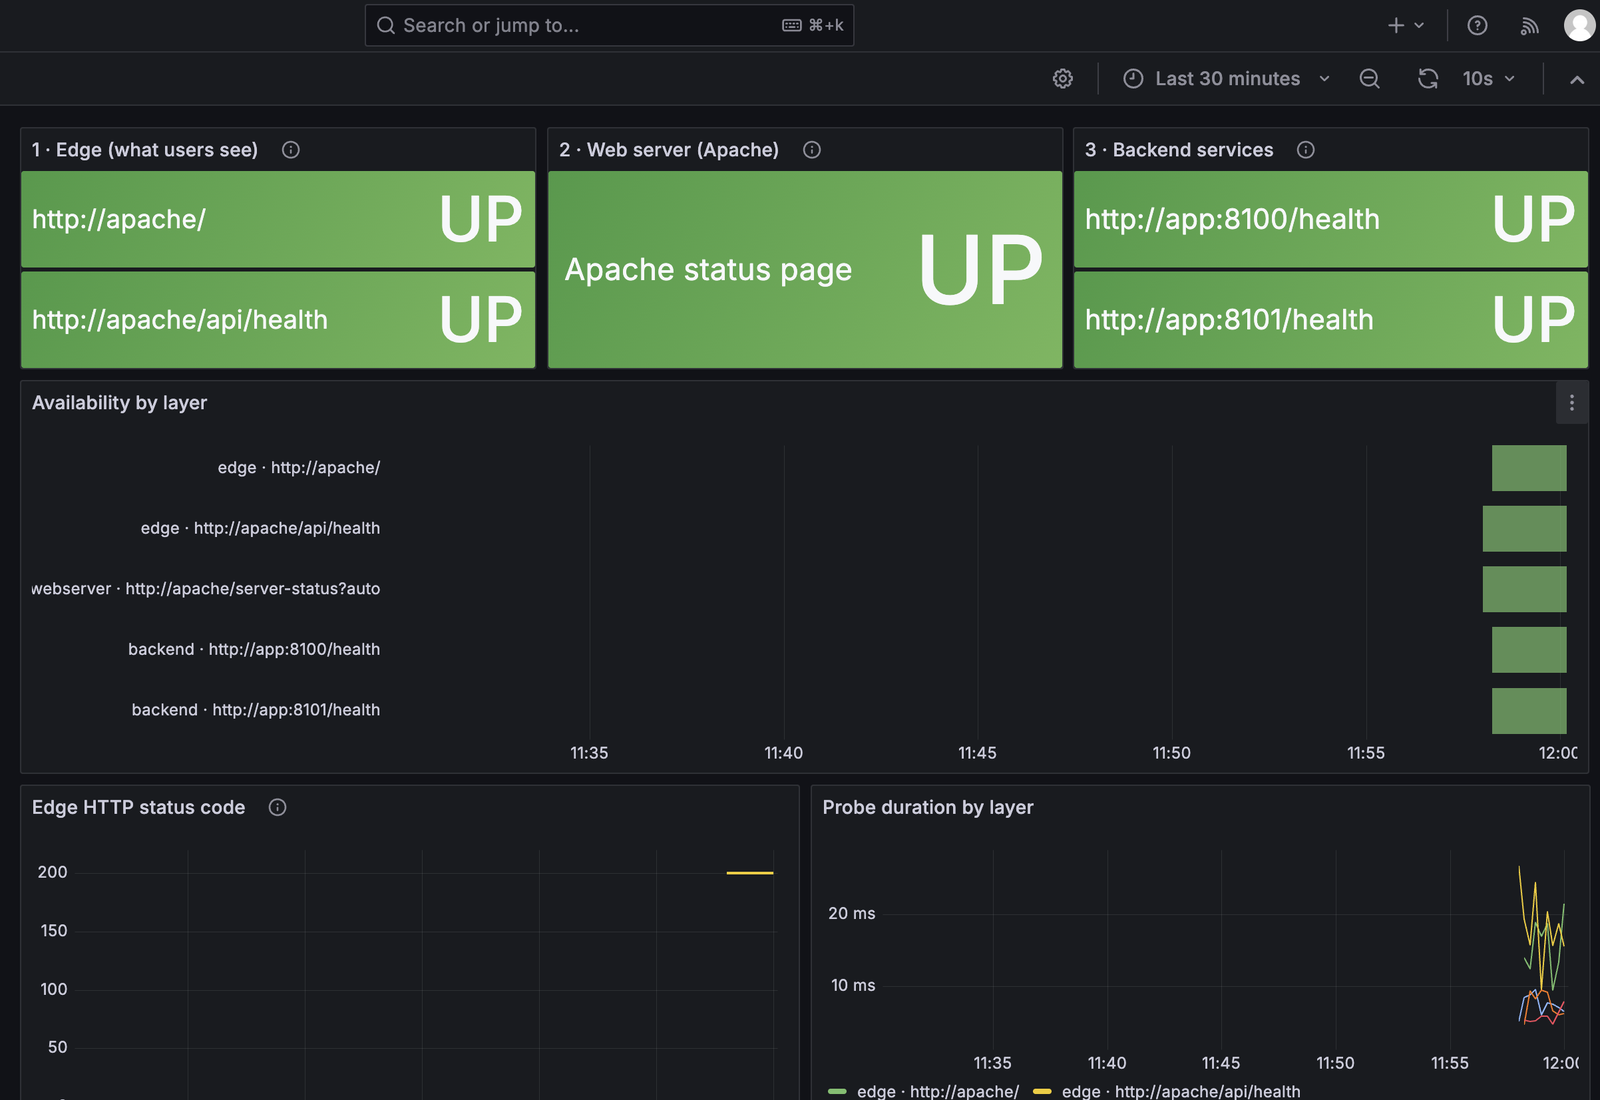
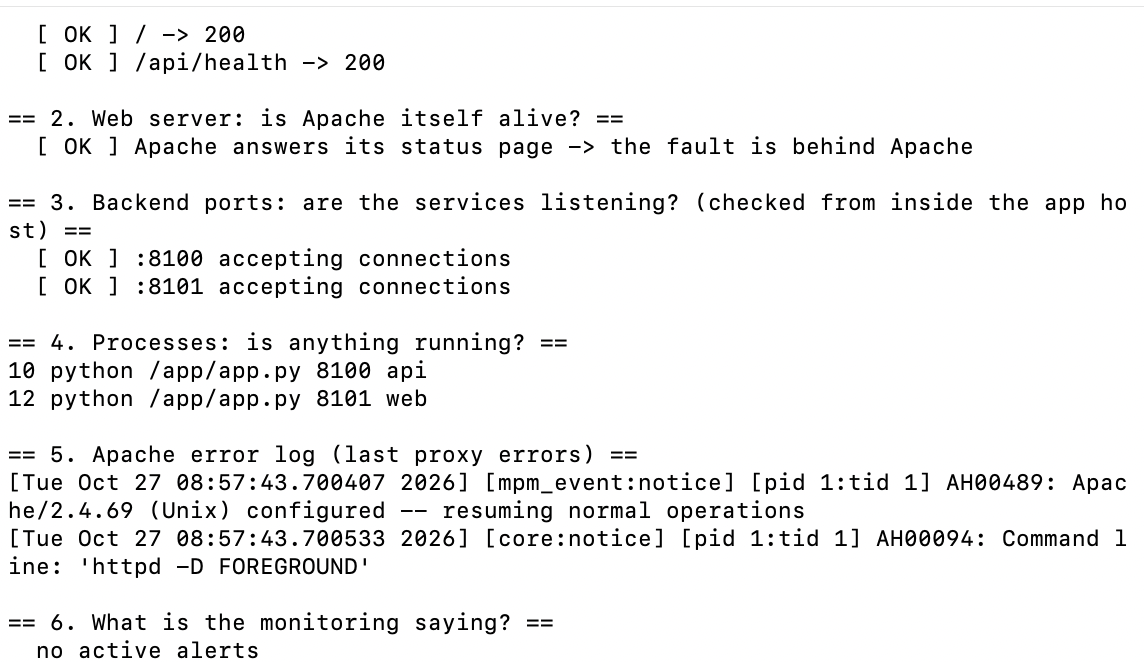
Here’s the healthy baseline. All three layers are green and the triage script passes every check:
Then I broke it:

Within a couple of scrapes the dashboard showed the same pattern as the real incident. The edge is down, Apache is up and both backends are down, and the status-code panel steps from 200 to 503:
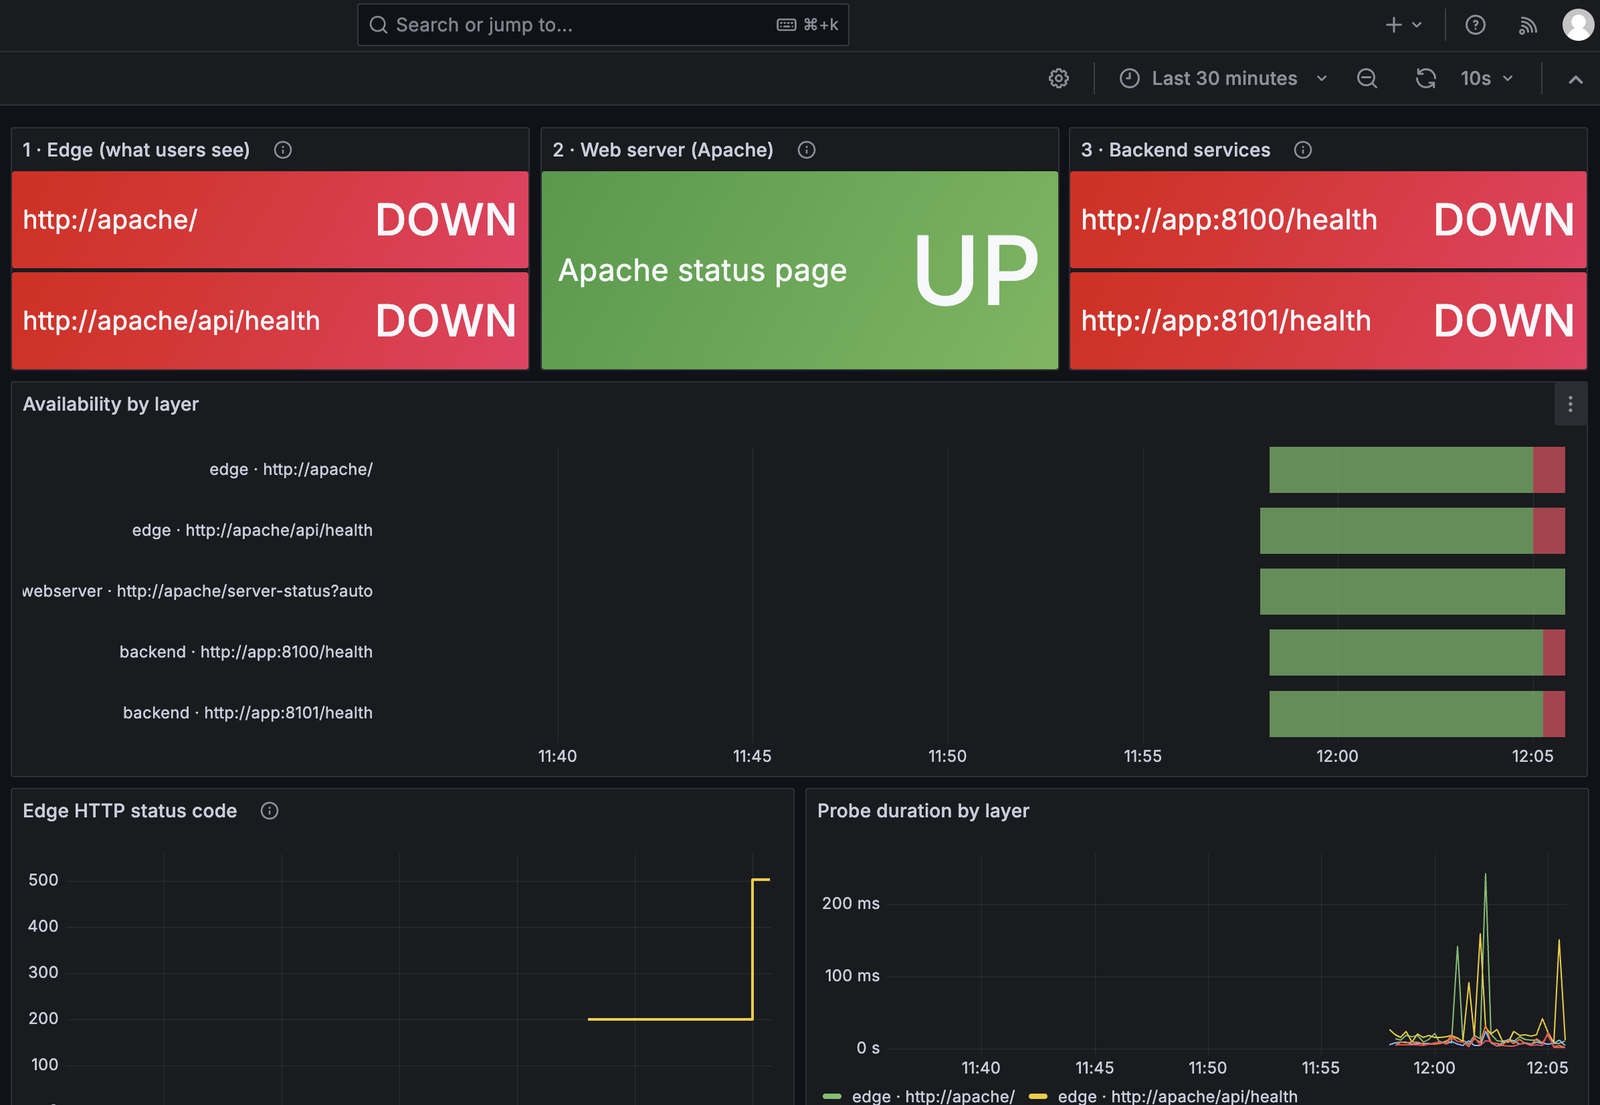
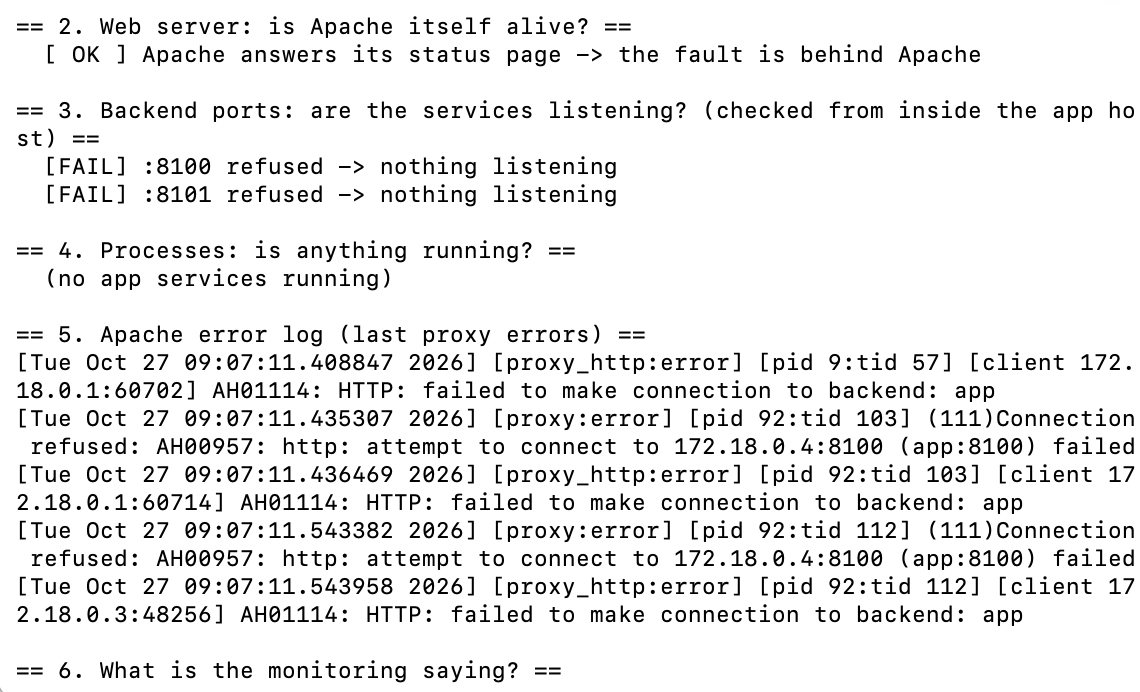
That three-panel pattern does most of the triage before you open a terminal. Running the script confirms it layer by layer: Apache answers, both ports refuse connections, no processes are running, and Apache’s log shows AH00957 Connection refused for each backend:
The alerts followed. Both rules went pending at 09:05:04 UTC, 12 seconds after the break, and fired one minute later once the for window passed:
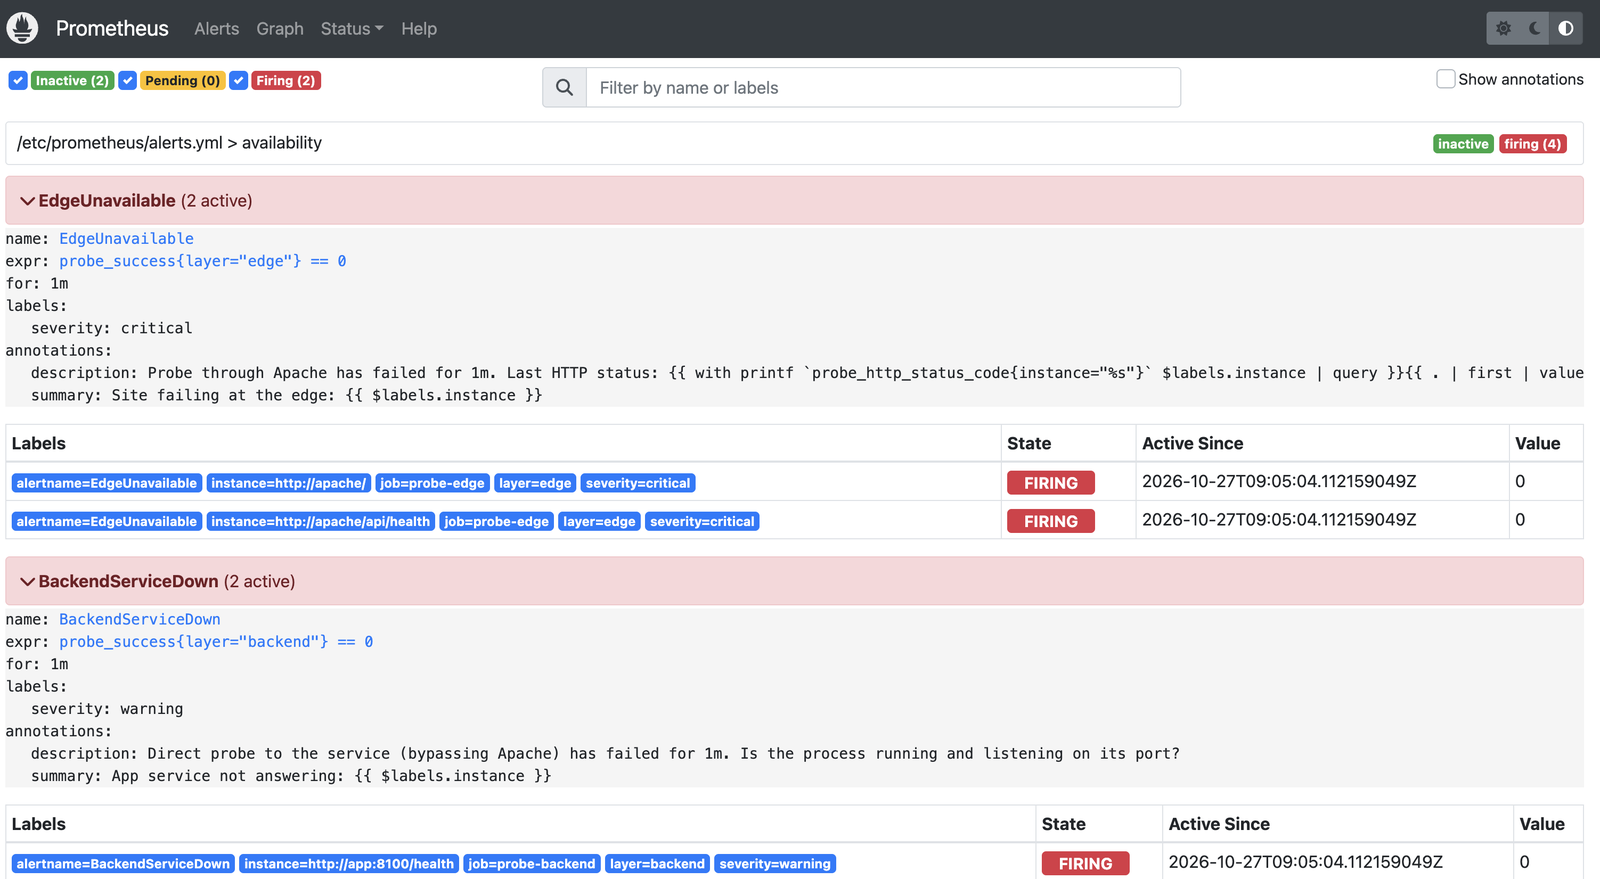
(The {{ ... }} in that screenshot is the rule’s template. Prometheus shows the raw rule on this page. The notification that goes out has the real values filled in, such as Last HTTP status: 503.)
Then I fixed it:

The next probes succeeded and every alert returned to inactive:
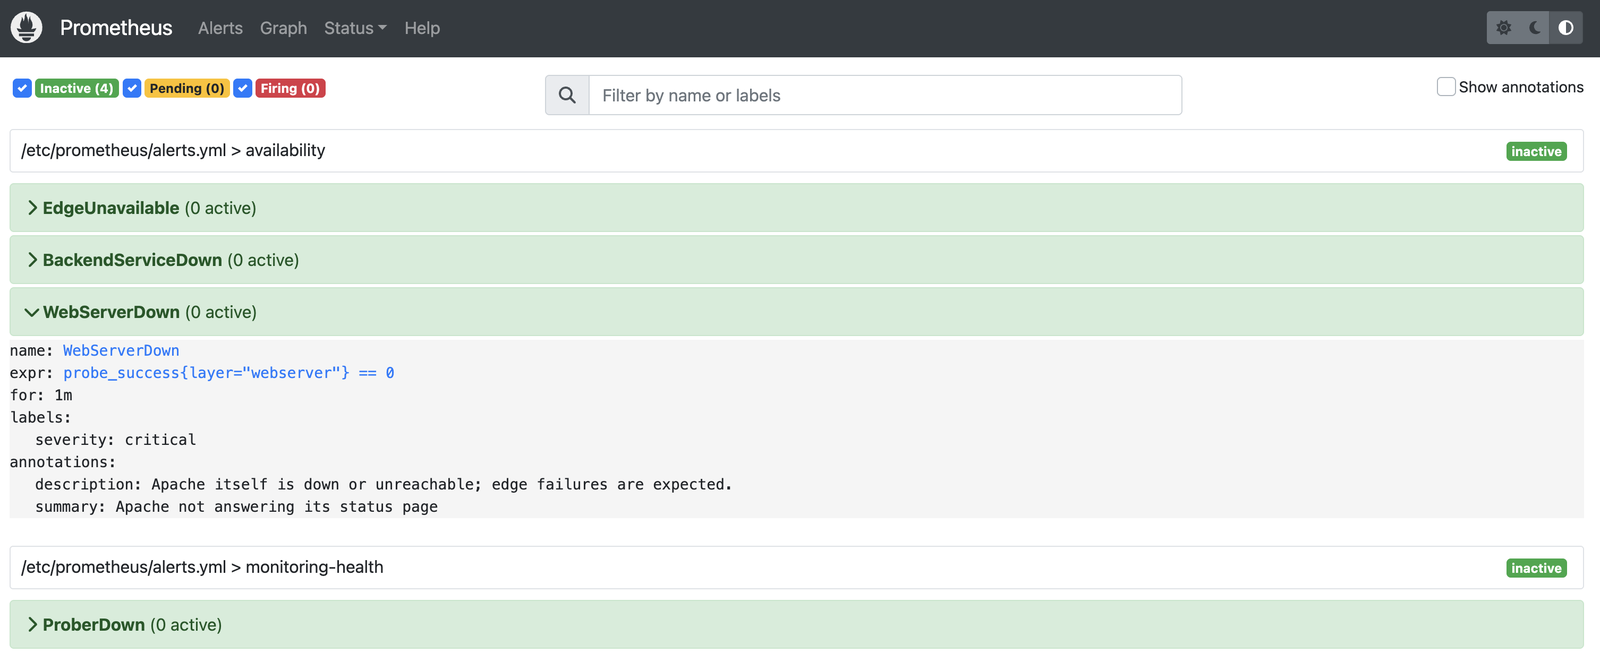
Time to detect went from about 39 hours to about 72 seconds. That’s a lab number, not a measurement from the real system, but the failure mode is the same and so is the gap it closes.
What I’d take back to a real environment
- Every environment people depend on needs at least one external probe. Staging included. “It’s only staging” is how a 503 goes unnoticed for two days.
- Probe the layers, not just the front door. An edge check tells you something’s wrong. A probe per layer tells you where.
- Restart policies don’t replace monitoring.
Restart=alwaysandrestart: alwayscover crashes, not someone stopping a service. - Add an audit trail. Monitoring tells you when something stopped. Session logging (SSM session logs,
auditd) tells you who stopped it and why. The real incident had neither.
Limitations of the lab
- The “edge” probe runs inside the Docker network, so it doesn’t exercise DNS, TLS or the public path. A real setup should also have an uptime check from outside the network.
- There’s a single prober.
ProberDowncovers the prober dying, but not a network partition between the prober and the targets. - Notifications go to a local webhook so the lab needs no accounts. The README shows the Slack receiver config.
Try it
git clone https://github.com/JoyKui33/edge-inward-lab.git
cd edge-inward-lab
cp .env.example .env
chmod +x scripts/*.sh
docker compose up -d --build
./scripts/break.sh   # then open http://localhost:3000
./scripts/triage.sh
./scripts/fix.sh
Next, I’m porting the same probes and alerts to an AWS staging lab built with Terraform, and later to Kubernetes with kube-prometheus-stack.